TRAFFIC GRAPHS
Real time traffic graphs drawn with SVG (Scalable Vector Graphics) are available that constantly update. You can find them under Status Traffic Graphs, and an example of the graph can be found in Figure Example LAN Graph. These will allow you to see traffic as it happens, and give a much clearer view of what is happening “now” than relying on averaged data from the RRD graphs.
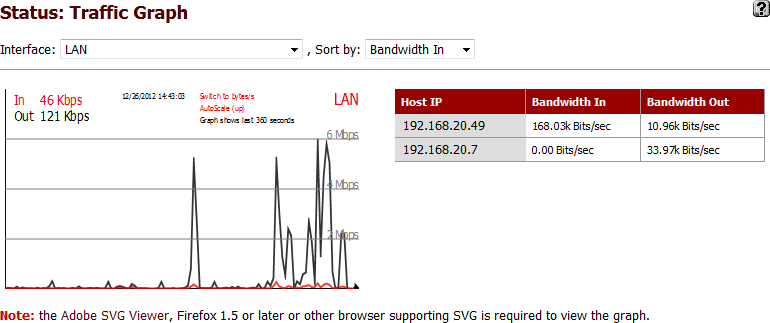
Only one interface is visible at a time, and you can choose which one to view from the Interface drop-down list. Once an interface is chosen, the page will automatically refresh and start displaying the new graph. The Dashboard feature in Defensebolt enables the simultaneous display of multiple traffic graphs on a single page.
A table containing momentary glimpses of data being transferring from specific IPs is also displayed next to the traffic graph. These are limited to only displaying briefly, so on going transfers are more likely to show up than quick connections. Also, only connection from within that interface’s primary subnet will be shown.