SYSTEM LOGS
DefenseBolt logs quite a bit of data by default, but does so in a manner that will not overflow the storage on the router. The logs are found under Status System Logs in the WebGUI, and under /var/log/ on the filesystem. Some components such as DHCP and IPsec, among others, generate enough logs that they have their own logging tabs to reduce the clutter in the main system log and ease troubleshooting for these individual services. To view these other logs, click the tab for the subsystem you want to view. Certain things, like the System, and VPN tabs, have sub-tabs with more related options grouped together.
DefenseBolt logs are contained in a binary circular log or clog format. These files are a fixed size, and never grow. As a consequence of this, the log will only hold a certain amount of entries, and the old entries are continually pushed out of the log as new ones are added. If this is an issue for you or your organization, you may adjust the log settings to copy these entries to another server with syslog where they may be permanently retained or rotated with less frequency. See Remote Logging with Syslog later in this section for information about syslog.Starting with DefenseBolt, the log files are retained at bootup on a full install, and their sizes have been slightly increased from previousversions.
System Logs
The system logs can be found under Status System Logs, on the System tab. This will include log entries generated by the host itself in addition to those created by some services and packages which do not have their logs redirected to other tabs/log files.
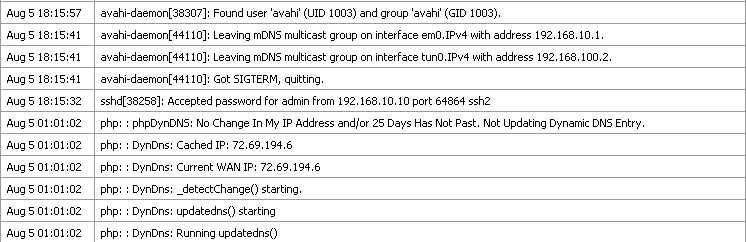
As you can see by the example entries System Log Entries, there are log entries from the SSH daemon, the avahi package, and the dynamic DNS client. Many other subsystems will log here, but most will not overload the logs at any one time. Typically if a service has many log entries it will be moved to its own tab/log file.
Also note in this example that the logs are configured to appear in reverse order, and the newest entries appear at the top of the list. See the next section to find out how to configure the logs for reverse order.
Changing Log Settings
Log settings may be adjusted by going to StatusSystem Logs and using the Settings tab. Here you will find several options to choose from thatcontrol how logs are displayed.
The first option, Show log entries in reverse order, controls the order in which logs are displayed on the various logging tabs. With this option checked, the newest entries will be at thetop of the log output. When this option is unchecked, the oldest entries will be at the top. Certain people find both of these methods usefuland easier to follow, so you can pick which ever setting you prefer.
The next setting, GUI Log Entries to Display, only controls how many log lines are displayed on each tab. The actual logs may contain more data, so this can be adjusted up or down a bit ifneeded to show more log data on each tab.
Normally, every packet blocked by the firewall’s default deny rule is logged. If you do not want to see these log entries, uncheck the Log packets blocked by the default rule option. Similarly, there are options to control Log packets blocked by ‘Block Bogon Networks’ rules and Log packets blocked by ‘Block Private Networks’ rules to toggle whether or not their respective rules generate log messages.
By default, the WebGUI web server process, lighttpd, will log errors to the main system log. This is OK in most cases but in certain environments the logs can be very noisy unnecessarily, and the Log errors from the web server process option will disable the logging from that process.
The Show raw filter logs option controls the output of the Firewall logs tab. When checked, the output will not be interpreted by the log parser, and will instead be displayed in its raw format. Sometimes this can aid in troubleshooting, or if you need support the raw log will give a technician more information than is normally seen in the default firewall log output. The raw logs are harder to read and interpret than the parsed logs, so this is typically left unchecked most of the time.
The Filter descriptions drop-down governs how firewall log entry descriptions are displayed. By default, with Don’t load descriptions , they are not shown, but you can click the action icon to see the associated rule description. Display as column will put the rule description intoan additional column. Display as a second row will put the description in its own row below the log entry, in a collapsible way.
If you would also like to disable local logging, you can check Disable writing log files to the local disk but this is not generally recommended.
Click Save when you are done making changes. The remaining options on this screen are discussed in the following section.
Remote Logging with Syslog
The other options under Status System Logs on the Settings tab are for using syslog to copy log entries to a remote server. Because the logs kept by DefenseBolt on the router itself are ofa finite size, copying these entries to a syslog server can help with trouble shooting and longterm monitoring. The logs on the router are of a fixed size, and they are cleared on reboot on NanoBSD, so having a remote copy can also help diagnose events that occur just before a router restarts or after they would have otherwise scrolled off the log.
Some corporate or legislative policies dictate how long logs must be kept for firewalls and similar devices. If your organization requires long-term log retention, you will need to configure a syslog server to receive and retain these logs.
To start logging remotely, check Send log messages to remote syslog server, and fill in an IPv4 address, IPv6 address, or hostname for up to three syslog servers in the Remote Syslog Servers section.
The syslog server is typically a server that isdirectly reachable from your pfSense system on a local interface. Logging can also be sent to a server across a VPN, but may need some extra configuration (see DefenseBolt-initiated Traffic and IPsec) You should not send syslog data directly across your WAN connection, as it is plain text and could contain sensitive information
Check the boxes for the log entries you would like copied to the syslog server. You can chooseto remotely log Everything, or individually select any of System events, Firewall events, DHCPservice events, Portal auth events, VPN events,Gateway monitoring events, Server load balancerevents, or Wireless events.
Be sure to click Save when you are finished making changes.
If you do not have a syslog server, it is fairly easy to set one up. See Syslog Server on Windows with Kiwi Syslog for information on settingup Kiwi Syslog on Windows. Almost any UNIX or UNIX-like system can be used as a syslog server.FreeBSD is described in the following section, but others may be similar.
Configuring a Syslog Server on FreeBSD
Setting up a syslog server on FreeBSD requires only a couple steps. In these examples, replace 192.168.1.1 with the IP address of your firewall, replace exco-rtr with the hostname of your firewall, and replace exco-rtr.example.com with the full hostname and domain of your firewall. I use 192.168.1.1 in these examples because it is recommended to do this with the internal address of your router, not a WAN type interface.
First, you will likely need an entry in /etc/hosts that contains the address and name of your firewall, like so:
| 192.168.1.1 exco-rtr exco-rtr.example.com |
Then you need to adjust syslogd ‘s startup flags to accept syslog messages from the firewall. Edit /etc/rc.conf and add this line if it doesn’t exist, or add this option to the existing line for the setting:
| syslogd_flagd=” -a ‘192.168.1.1’” |
Lastly, you’ll need to add some lines to /etc/syslog.conf that will catch log entries from this host. Underneath any other existing entries, add the following lines:
| !* +* + ‘exco-rtr’ . /var/log/ ‘exco-rtr’.log |
Those lines will reset the program and host filters, and then set a host filter for your firewall (use its short name as entered in /etc/hosts). If you are familiar with syslog, you can look at /etc/syslog.conf on the pfSense router and also filter the logs for various services into separate log files on the syslog server.
After these changes you will need to restart syslogd. On FreeBSD this is just one simple command:
| # ‘ /etc/rc.d/syslogd restart ‘ |
You should now be able to look at the log file on the syslog server and see it populating withlog entries as activity happens on the firewall.