PFTOP
PFtop gives you a real-time view of the firewall states, and the amount of data they have sent and received. It can help pin point what IP addresses and sessions are currently using bandwidth, and may also help diagnose other network connection issues. See Viewing with pftop for more details.
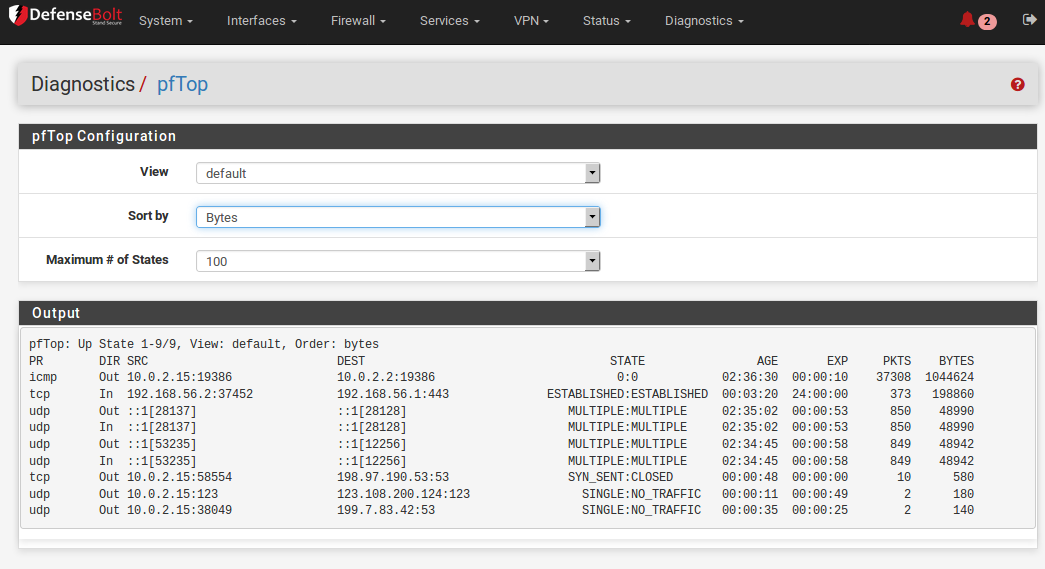
pftop is available from the GUI and the system console menu, and offers a live view of the state table along with the total amount of bandwidth consumed by each state. In the GUI, only the default view is available from under Diagnostics pfTop. From the console, there are several ways to alter the view while watching pfTop. Press h to see a help screen that explains the available choices. The most common uses are using 0 through 8 to select different views, space for an immediate update, and q to quit.